
Every year, millions of people take prescription drugs. Most do fine. But some have unexpected reactions-rare side effects, dangerous interactions, or allergic responses that didn’t show up in clinical trials. That’s where the FDA Adverse Event Reporting System (FAERS) comes in. It’s not a secret database. It’s not locked behind paywalls. It’s public. And it’s one of the most powerful tools we have to spot hidden dangers in medications after they’ve reached the market.
What is FAERS, and why does it matter?
FAERS is the U.S. Food and Drug Administration’s official database for collecting reports of adverse events linked to drugs and biologics. Think of it as a national early-warning system. When someone has a bad reaction to a medication-whether it’s a patient, doctor, pharmacist, or even a family member-they can report it. Pharmaceutical companies are legally required to submit reports too. Since 1969, this system has gathered over 30 million reports. About 2 million new ones are added every year.Here’s the key thing to understand: FAERS doesn’t prove that a drug caused a side effect. It shows patterns. If 500 people report severe liver damage after taking Drug X, and only 2 people report it with Drug Y, that’s a signal. It doesn’t mean Drug X is dangerous-it means the FDA should look closer. That’s how warnings get added to labels, or in rare cases, drugs get pulled from the market.
The system runs on a strict standard called ICH E2B(R3), which ensures data is structured the same way whether it comes from a hospital in New York or a pharmacy in Texas. Reports include basic patient info (age, gender, initials), the drug(s) involved, the adverse event described using standardized medical terms (MedDRA), and the outcome-like hospitalization, disability, or death.
How to access FAERS data: Three ways, three levels of access
You don’t need a research degree or a government badge to use FAERS. There are three main ways to get at the data, each suited for different needs.1. FAERS Public Dashboard (for everyone)
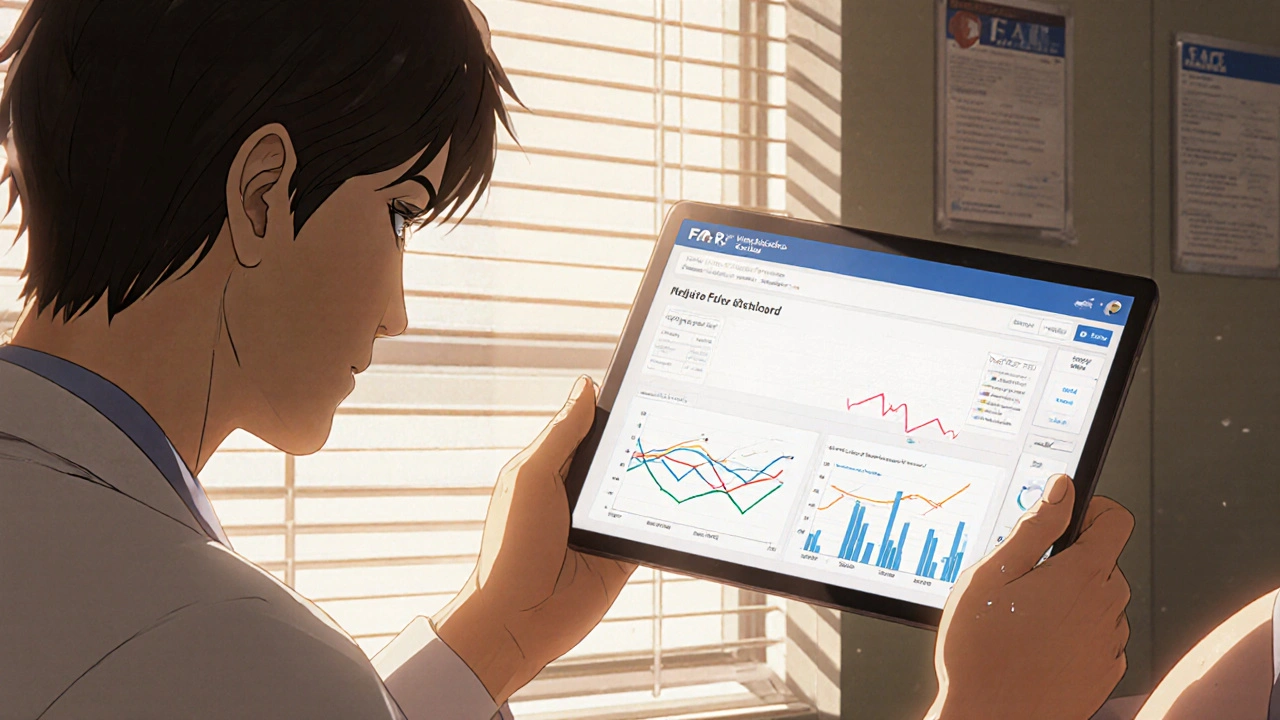
This is the easiest entry point. Launched in 2023, the dashboard is a web-based tool that lets you search, filter, and visualize data without writing a single line of code. You can pick a drug-say, Ozempic-and see how many reports mention nausea, pancreatitis, or gallbladder issues over the last five years. You can compare drugs side by side, filter by age group, gender, or outcome.It’s perfect for patients, caregivers, journalists, or students. No training needed. You can learn how to use it in an hour. The interface shows charts, tables, and trends. You can even download summary reports as PDFs.
But here’s the catch: the dashboard only shows aggregated data. It doesn’t let you see individual reports. And it doesn’t give you raw numbers for how many people took the drug in the first place-so you can’t calculate true risk rates.
2. Quarterly Data Extracts (for researchers and analysts)
If you’re doing academic research, public health analysis, or working for a small nonprofit, you’ll want the raw data. The FDA releases full datasets every quarter in two formats: ASCII (plain text) and XML (structured data). Each file is between 1 and 5 gigabytes-so you need a decent computer and some basic tech skills.These files contain every report submitted, with all the details: patient age, drug names, MedDRA codes, reporter type, and outcome. But you’ll need to know how to clean and analyze them. Most people use R or Python with libraries like pandas or dplyr. The challenge? Many reports are incomplete. About 30% have missing or inconsistent data. And you have to understand MedDRA coding-like how “heart attack” and “myocardial infarction” are linked under the same hierarchy.
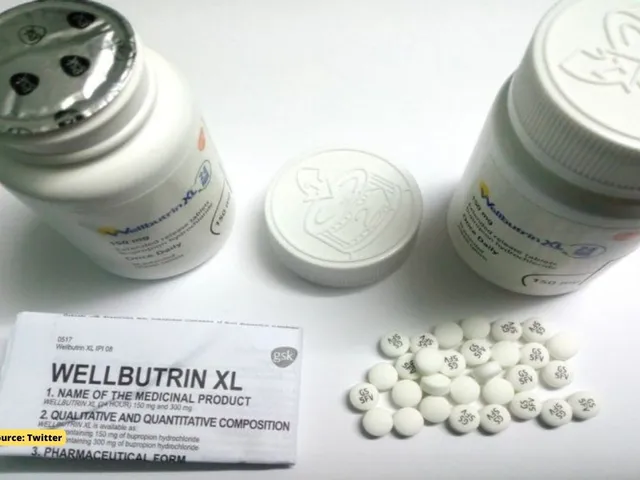
It’s not for beginners. But if you’ve got 40-60 hours to learn, you can uncover real insights. One research team at Johns Hopkins used this data to spot a rare interaction between a common antidepressant and a diabetes drug that affected 1 in 10,000 users. That kind of discovery only happens when you dig into the raw numbers.
3. OpenFDA API (for developers and tech teams)
If you’re building an app, a research tool, or a data pipeline, the OpenFDA API is your best bet. It gives you direct, programmatic access to FAERS data in JSON format. You can write a script that pulls all reports for a specific drug in the last 12 months and automatically flags unusual patterns.The API is free, well-documented, and used by universities, startups, and even some hospitals. But it’s not user-friendly. You need to know how to make API calls, handle pagination, and parse JSON. If you’re not a developer, this isn’t the route for you.
What FAERS can’t tell you-and why it’s still valuable
Let’s be clear: FAERS is not a perfect tool. It has big limitations.- No denominator data: You don’t know how many people took the drug. So if 100 people report nausea from Drug A, and only 10 from Drug B, it doesn’t mean Drug A is worse-it might just be used by 10 times more people.
- Reporting bias: Serious events get reported more often. Mild side effects? Often ignored. Patients taking new drugs report more than those on long-term prescriptions. And healthcare professionals report more than patients.
- Not verified: The FDA doesn’t confirm whether the drug actually caused the reaction. A report might say “patient had a stroke after taking statin,” but the stroke could’ve been unrelated.
- Incomplete data: Missing dates, wrong drug names, vague descriptions-these are common. One study found nearly a third of reports lacked key details.
So why use it? Because it’s the only system of its scale that’s free and open. The European Medicines Agency’s EudraVigilance database doesn’t let the public see individual reports. VigiBase, the WHO’s global system, has more data but far fewer public tools. FAERS gives you the raw material to ask questions-and that’s powerful.

Who uses FAERS, and how?
The users are diverse:- Academic researchers (55% of users): They use FAERS to study drug safety patterns, publish papers, and support regulatory decisions. A 2023 study in Frontiers in Pharmacology used FAERS to analyze long-term risks of weight-loss drugs.
- Pharmaceutical companies (30%): All top 50 drugmakers use FAERS data-but most through commercial platforms like Oracle Argus or ArisGlobal, which clean and analyze the data for them. They’re not using the public dashboard; they’re buying deeper analytics.
- Patient advocates (15%): Groups like the National Organization for Rare Disorders have used FAERS to identify previously unknown side effects in medications for rare diseases. One group found a pattern of pancreatitis linked to a diabetes drug used off-label for weight loss, leading to a warning update.
- Healthcare providers: Some doctors use the dashboard to answer patient questions. “I’ve seen this reaction before,” they say, pulling up the data on their tablet during a visit.
Since 2020, academic use of FAERS has grown 35% each year. More journals now require researchers to cite FAERS data when studying drug safety. And with the 21st Century Cures Act mandating more transparency, the pressure to use this data is only growing.
What’s changing in 2025?
The FDA isn’t standing still. In January 2024, they switched to ICH E2B(R3), which makes data more precise and easier to compare across countries. That’s a big deal for global drug safety.Later this year, the FDA plans to launch a new version of the Public Dashboard with natural language search. Instead of picking from dropdown menus, you’ll be able to type: “Show me all reports of suicidal thoughts with fluoxetine.” The system will understand what you mean.
They’re also testing an API that lets you pull dashboard results directly into your own tools-no downloading files, no coding XML parsers. And by 2027, they aim to link FAERS with real-world data from Medicare claims and electronic health records. That could finally give us the denominator: how many people actually took the drug.
How to get started today
If you’re curious about a medication’s safety profile, here’s how to begin:- Go to the FAERS Public Dashboard.
- Type in the drug name (e.g., “Metformin” or “Lisinopril”).
- Filter by time (last year, last 5 years), patient age, or outcome.
- Look for trends: Are certain side effects rising? Are they clustered in a specific group?
- Don’t panic over a single report. Look at the big picture.
If you’re a researcher or analyst:
- Download the latest quarterly data from the FAERS data download page.
- Use R or Python to clean the data. Remove duplicates, standardize drug names, map MedDRA codes.
- Use statistical tools like proportional reporting ratios (PRR) or Bayesian confidence propagation neural networks (BCPNN) to identify signals.
- Always pair FAERS findings with clinical context. Don’t treat numbers as proof.
Common mistakes to avoid
- Confusing association with causation: Just because a side effect is reported with a drug doesn’t mean the drug caused it.
- Ignoring underreporting: Most mild reactions never get reported. FAERS misses a lot.
- Using outdated data: The latest quarter is always 3-4 months behind. Use only current releases.
- Not understanding MedDRA: “Headache” and “cephalalgia” are the same. Learn how the hierarchy works.
- Forgetting the denominator: You can’t say “Drug X causes heart attacks in 1% of users” from FAERS alone.
The best users of FAERS aren’t the ones with the most data-they’re the ones who ask the right questions and know the limits of what the system can show.
Frequently Asked Questions
Is the FDA Adverse Event Reporting System (FAERS) free to use?
Yes. The FAERS Public Dashboard, quarterly data extracts, and OpenFDA API are all completely free. You don’t need to pay, register, or request special access to use any of the public tools. Only pharmaceutical companies submitting reports directly to the FDA need to go through a formal submission process.
Can I find out who reported an adverse event?
No. All personally identifiable information-like names, addresses, or exact dates of birth-is removed from public data. The FDA protects privacy by anonymizing reports before release. Even in raw data files, you’ll only see initials, age ranges, and gender-not full identities.
How often is FAERS data updated?
The FDA releases new data quarterly, about 3-4 months after the end of each quarter. So data from January-March will be available around July. The Public Dashboard updates at the same time. Always check the FDA’s FAERS data download page for the latest release date.
What’s the difference between FAERS and MedWatch?
MedWatch is the FDA’s program for collecting adverse event reports. FAERS is the database that stores those reports. Think of MedWatch as the reporting channel-whether you file online, by phone, or by mail-and FAERS as the archive where all those reports live. You report through MedWatch; you analyze the data using FAERS tools.
Can I report an adverse event myself?
Yes. Anyone can report an adverse event through the FDA’s MedWatch portal. You don’t need to be a doctor. If you or someone you know had a bad reaction to a medication, vaccine, or medical device, your report matters. The FDA encourages consumer reports-they help fill gaps in the data.
Why do some drugs show more reports than others?
Drugs with higher usage-like metformin or ibuprofen-naturally have more reports. Also, newer drugs get more attention, so side effects are reported more often. And drugs with serious side effects (like those for cancer or mental health) are more likely to be reported. More reports don’t always mean more danger-they often mean more exposure or more awareness.
Next steps: What to do after you explore FAERS
If you used the dashboard and found something unusual, don’t assume the worst. Talk to your doctor. Share what you saw, but bring context. Say: “I noticed a pattern of X side effect in FAERS. Is this something we should watch for?”If you’re a researcher, pair FAERS data with other sources-clinical trial results, real-world claims data, or lab studies. FAERS is a starting point, not an endpoint.
If you’re a patient, remember: this data helps improve safety for everyone. Your report could help someone else avoid a bad reaction. And if you’re curious about a drug’s safety, you now have the tools to look beyond marketing claims and ask the real questions.


Darragh McNulty
22 November 2025 - 12:23 PM
This is such a dope breakdown! 🙌 Finally someone explains FAERS without making it sound like rocket science. I showed this to my aunt who’s on 7 meds and she actually understood it. Thank you!!
Cooper Long
22 November 2025 - 21:02 PM
The structural integrity of FAERS data under ICH E2B(R3) represents a significant advancement in pharmacovigilance infrastructure. While limitations exist, the transparency afforded by this system remains unparalleled in global regulatory frameworks.
David Cusack
23 November 2025 - 12:42 PM
Let’s be honest-most people who use the dashboard don’t know MedDRA from a hole in the ground, and they’re misinterpreting relative risk as absolute risk… again. The FDA should just put a disclaimer in Comic Sans: "This is not a clinical decision tool. You’re not a doctor. Stop panicking."
Sandi Moon
23 November 2025 - 19:45 PM
You know what they’re not telling you? FAERS is being quietly weaponized. The pharmaceutical lobby funds the "cleaning" of reports-removing anything that implicates their blockbuster drugs. The "incomplete data" isn’t accidental. It’s sanitized. The FDA is a captive of Big Pharma. You think this is transparency? It’s theater.
Chris Vere
24 November 2025 - 17:34 PM
Interesting how we treat data like it has inherent truth. FAERS is a mirror of human behavior-what people notice, what they report, what they fear. The numbers don’t lie but they don’t tell the whole story either. Maybe the real question is not what the data shows but why we’re so desperate to believe it
Pravin Manani
26 November 2025 - 13:35 PM
The proportional reporting ratio (PRR) methodology is critical here. Without adjusting for background rates and exposure denominators, any signal detection is statistically suspect. I’ve seen junior researchers get burned by this-especially when they conflate frequency with causality. Always cross-validate with real-world evidence. FAERS is a hypothesis generator, not a verdict.
Mark Kahn
27 November 2025 - 22:44 PM
If you’re a patient and you notice something weird after starting a new med, just report it. Even if it seems small. I reported a weird tingling after my blood pressure med and six months later, they added it to the label. Your voice matters more than you think.
Leo Tamisch
29 November 2025 - 20:41 PM
I mean… we’re all just data points in the machine, right? 🤔 FAERS, MedWatch, EudraVigilance… it’s all just the system trying to make sense of chaos. But who’s really in control? The FDA? Or the algorithms? I’ve been thinking about this a lot lately… like, is safety even possible in capitalism?
Sheldon Bazinga
30 November 2025 - 06:45 AM
LMAO at all these "researchers" acting like they cracked the code with pandas. Bro the data is 30% garbage. Half the reports say "drug x caused heart attack" but the patient was 92 and had 5 stents. And you call that science? This is why America’s meds are so expensive-we’re chasing ghosts in a database full of typos. Go fix your spelling first.